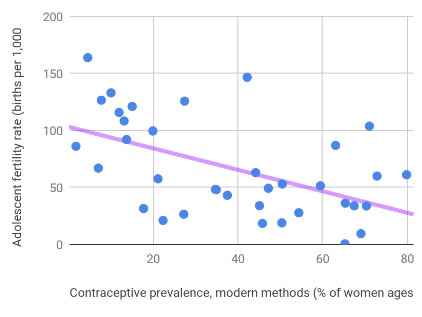
Computer Project - World Correlation:
- Get some data: Find any two things of interest from the website
listed below

- It will work best if they are the same units (so both % or relative values) IE % of woman working and fertility rate would work. As opposed to Population of a country and % woman working, probably not.
- Start at this database
- Find at least 20 countries, choose some rich ones, some poor ones. Pick two variables that you think are correlated (have a relationship) - check with me before you get too far.
- Enter the country name and each variable on your spreadsheet (like this - made up data)
- Create a scatterplot
- Add a linear trendline - is it appropr0iate to add a linear trendline? - find the equation of the trendline. (VIDEO HOW TO)
- Find the correlation coefficient (r) [square root of r2]
- What countries are outliers? Discuss reasons they might be outliers.
- Describe the relationship and a conclusion (just 2 sentences describing the relationship and any insights)
Add your results (graph/conclusion) with your name to this slideshow (put your slide in here) (Example)
Rubric:
Exceeds: conclusion is thorough. Outliers are well identified. Data is same units (as described above). Graphically layout nicely.
8 point project
- 1 - 2 variables chosen that are interesting
- 1 - scatterplot is created
- labeled (.5 points)
- 1 - trendline added
- 1 - r - found and explained
- 1 - outliers identified
- 1- conclusion